
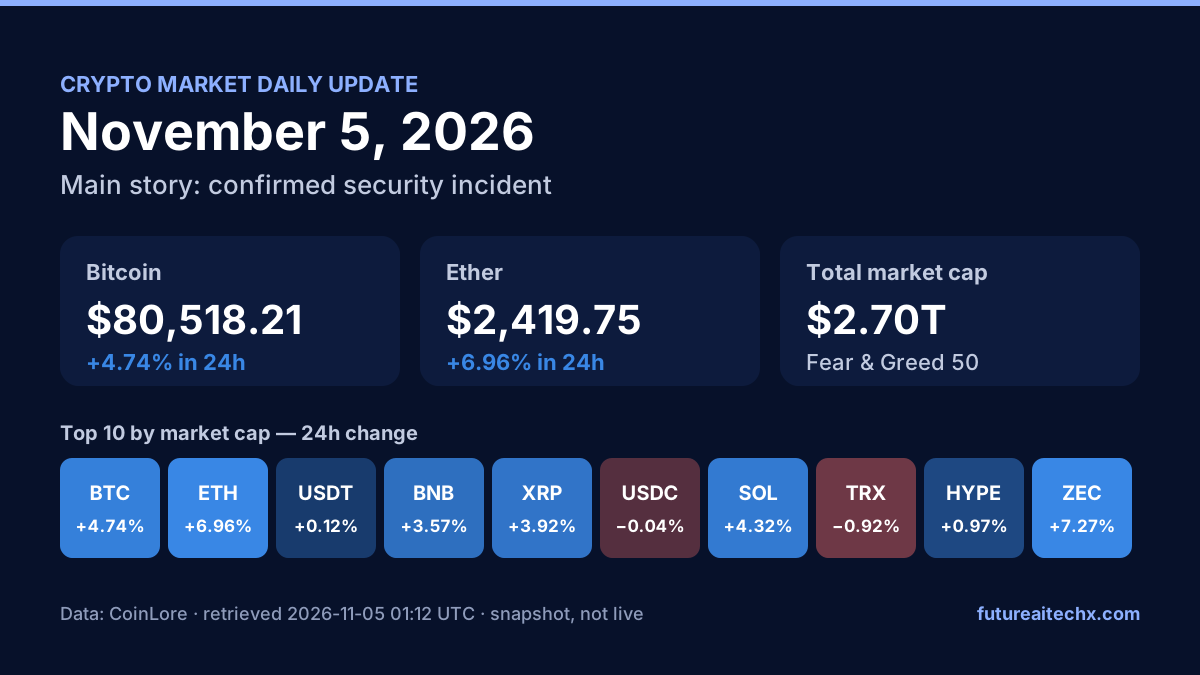
Bitcoin rose 4.74% to $80,518.21 and Ether gained 6.96% to $2,419.75 over the 24 hours to Nov 5, 2026, 06:57 (Asia/Kathmandu, UTC+05:45), as total crypto market capitalization stood at $2.70 trillion (+4.71%).
Daily crypto market overview
Measured: 80 of the 87 largest non-stablecoin assets rose and 5 fell. Bitcoin ended the window at $80,518.21 (+4.74%) and Ether at $2,419.75 (+6.96%). Against the previous daily report, Bitcoin is +4.69% and total market capitalization +4.71%.
Analysis: The crypto market has seen a significant increase in the last 24 hours, with the total market cap rising by 4.71% to $2.70 trillion and Bitcoin's price increasing by 4.74% to $80,518.21, which may have been driven by a shift in market sentiment as evidenced by the Crypto Fear & Greed Index moving from 34 to 50. The market breadth also suggests a broadly positive trend, with 80 of 87 non-stablecoin top-100 assets rising. Ether's price has increased by 6.96% to $2,419.75, outpacing Bitcoin's gain. The increase in Bitcoin's price may have coincided with the market's reaction to the US midterms, as reported by The Block. The rebound in Bitcoin's price past $80,000, as noted by The Block, may have also been influenced by the market's ability to shrug off the Binance hack. The Crypto Fear & Greed Index's move from Fear to Neutral may have contributed to the increase in crypto prices, as it…
Market snapshot: Bitcoin, Ether and the leading cryptocurrencies
| Asset | Price (USD) | 24h change | Market cap | 24h volume |
|---|---|---|---|---|
| Bitcoin BTC | $80,518.21 | +4.74% | $1.61T | $127.74B |
| Ethereum ETH | $2,419.75 | +6.96% | $296.12B | $14.54B |
| Tether USDT | $0.9993 | +0.12% | $183.11B | $61.64B |
| Binance Coin BNB | $718.23 | +3.57% | $99.97B | $803.41M |
| XRP XRP | $1.30 | +3.92% | $77.87B | $2.22B |
| USD Coin USDC | $1.00 | −0.04% | $74.03B | $7.89B |
| Solana SOL | $95.75 | +4.32% | $52.01B | $3.05B |
| TRON TRX | $0.3196 | −0.92% | $30.25B | $415.65M |
| Hyperliquid HYPE | $84.30 | +0.97% | $28.15B | $1.24B |
| Zcash ZEC | $1,291.25 | +7.27% | $20.95B | $1.29B |
| Staked Ether STETH | $2,419.36 | +6.94% | $20.69B | $32.85M |
| Ethena USDe USDE | $1.00 | +0.03% | $14.08B | $22.68M |
| Dogecoin DOGE | $0.07693 | +3.97% | $12.94B | $577.69M |
| Monero XMR | $638.42 | +1.99% | $11.78B | $238.82M |
| Wrapped Bitcoin WBTC | $80,360.02 | +7.25% | $10.24B | $27.12M |
| Wrapped stETH WSTETH | $3,026.09 | +7.15% | $9.49B | $7.65M |
| Dohrnii DHN | $522.95 | +3.80% | $8.93B | $1.04M |
| Wrapped Beacon ETH WBETH | $2,682.48 | +7.07% | $8.76B | $4.49M |
| WETH WETH | $2,367.78 | +3.56% | $7.99B | $20.47M |
| ChainLink LINK | $11.40 | +5.40% | $7.73B | $347.34M |
Bitcoin and Ether price charts
View chart data
| Time | Value |
|---|---|
| Nov 4, 07:45 | $76,673.77 |
| Nov 4, 08:45 | $76,323.66 |
| Nov 4, 09:45 | $76,844.72 |
| Nov 4, 10:45 | $77,617.61 |
| Nov 4, 11:45 | $78,004.20 |
| Nov 4, 12:45 | $78,137.53 |
| Nov 4, 13:45 | $78,312.00 |
| Nov 4, 14:45 | $78,340.00 |
| Nov 4, 15:45 | $78,643.06 |
| Nov 4, 16:45 | $78,640.97 |
| Nov 4, 17:45 | $78,259.85 |
| Nov 4, 18:45 | $78,307.00 |
| Nov 4, 19:45 | $78,989.20 |
| Nov 4, 20:45 | $80,608.79 |
| Nov 4, 21:45 | $80,660.61 |
| Nov 4, 22:45 | $80,293.00 |
| Nov 4, 23:45 | $80,410.24 |
| Nov 5, 00:45 | $80,109.00 |
| Nov 5, 01:45 | $80,185.84 |
| Nov 5, 02:45 | $80,144.00 |
| Nov 5, 03:45 | $80,881.94 |
| Nov 5, 04:45 | $80,425.60 |
| Nov 5, 05:45 | $80,606.81 |
| Nov 5, 06:45 | $80,518.21 |
| Nov 5, 06:57 | $80,518.21 |
View chart data
| Time | Value |
|---|---|
| Oct 29, 07:45 | $79,904.99 |
| Oct 29, 08:45 | $79,852.90 |
| Oct 29, 09:45 | $79,739.07 |
| Oct 29, 10:45 | $80,138.67 |
| Oct 29, 11:45 | $80,115.75 |
| Oct 29, 12:45 | $79,849.42 |
| Oct 29, 13:45 | $79,737.31 |
| Oct 29, 14:45 | $79,954.35 |
| Oct 29, 15:45 | $80,092.01 |
| Oct 29, 16:45 | $80,185.60 |
| Oct 29, 17:45 | $80,057.41 |
| Oct 29, 18:45 | $79,947.60 |
| Oct 29, 19:45 | $80,188.50 |
| Oct 29, 20:45 | $81,090.06 |
| Oct 29, 21:45 | $81,698.54 |
| Oct 29, 22:45 | $81,173.03 |
| Oct 29, 23:45 | $80,798.49 |
| Oct 30, 00:45 | $80,762.26 |
| Oct 30, 01:45 | $80,743.29 |
| Oct 30, 02:45 | $78,744.03 |
| Oct 30, 03:45 | $78,890.57 |
| Oct 30, 04:45 | $78,862.27 |
| Oct 30, 05:45 | $77,780.33 |
| Oct 30, 06:45 | $77,058.45 |
| Oct 30, 07:45 | $76,634.81 |
| Oct 30, 08:45 | $77,218.43 |
| Oct 30, 09:45 | $78,016.94 |
| Oct 30, 10:45 | $78,069.07 |
| Oct 30, 11:45 | $78,381.81 |
| Oct 30, 12:45 | $78,477.74 |
| Oct 30, 13:45 | $78,017.76 |
| Oct 30, 14:45 | $77,873.26 |
| Oct 30, 15:45 | $77,552.34 |
| Oct 30, 16:45 | $77,699.49 |
| Oct 30, 17:45 | $77,241.91 |
| Oct 30, 18:45 | $77,318.98 |
| Oct 30, 19:45 | $76,985.40 |
| Oct 30, 20:45 | $77,059.00 |
| Oct 30, 21:45 | $77,459.46 |
| Oct 30, 22:45 | $77,202.35 |
| Oct 30, 23:45 | $77,031.58 |
| Oct 31, 00:45 | $76,482.51 |
| Oct 31, 01:45 | $76,715.40 |
| Oct 31, 02:45 | $76,764.14 |
| Oct 31, 03:45 | $76,537.99 |
| Oct 31, 04:45 | $76,786.20 |
| Oct 31, 05:45 | $77,180.42 |
| Oct 31, 06:45 | $77,389.79 |
| Oct 31, 07:45 | $77,241.32 |
| Oct 31, 08:45 | $77,287.59 |
| Oct 31, 09:45 | $77,011.23 |
| Oct 31, 10:45 | $77,041.39 |
| Oct 31, 11:45 | $77,119.43 |
| Oct 31, 12:45 | $77,239.40 |
| Oct 31, 13:45 | $77,205.83 |
| Oct 31, 14:45 | $77,208.14 |
| Oct 31, 15:45 | $77,319.35 |
| Oct 31, 16:45 | $77,260.93 |
| Oct 31, 17:45 | $77,465.00 |
| Oct 31, 18:45 | $77,395.72 |
| Oct 31, 19:45 | $77,365.63 |
| Oct 31, 20:45 | $77,275.06 |
| Oct 31, 21:45 | $77,443.12 |
| Oct 31, 22:45 | $77,461.92 |
| Oct 31, 23:45 | $77,559.24 |
| Nov 1, 00:45 | $77,484.87 |
| Nov 1, 01:45 | $77,428.18 |
| Nov 1, 02:45 | $77,406.90 |
| Nov 1, 03:45 | $77,523.93 |
| Nov 1, 04:45 | $77,405.42 |
| Nov 1, 05:45 | $77,423.98 |
| Nov 1, 06:45 | $77,533.79 |
| Nov 1, 07:45 | $77,586.09 |
| Nov 1, 08:45 | $77,589.46 |
| Nov 1, 09:45 | $77,647.87 |
| Nov 1, 10:45 | $77,664.36 |
| Nov 1, 11:45 | $77,764.99 |
| Nov 1, 12:45 | $77,858.59 |
| Nov 1, 13:45 | $77,815.86 |
| Nov 1, 14:45 | $78,110.24 |
| Nov 1, 15:45 | $77,980.00 |
| Nov 1, 16:45 | $77,888.10 |
| Nov 1, 17:45 | $77,826.90 |
| Nov 1, 18:45 | $77,748.44 |
| Nov 1, 19:45 | $77,893.09 |
| Nov 1, 20:45 | $77,924.66 |
| Nov 1, 21:45 | $77,854.89 |
| Nov 1, 22:45 | $78,020.01 |
| Nov 1, 23:45 | $77,853.98 |
| Nov 2, 00:45 | $77,763.56 |
| Nov 2, 01:45 | $77,685.35 |
| Nov 2, 02:45 | $77,789.22 |
| Nov 2, 03:45 | $77,771.49 |
| Nov 2, 04:45 | $77,704.09 |
| Nov 2, 05:45 | $78,230.55 |
| Nov 2, 06:45 | $78,021.99 |
| Nov 2, 07:45 | $78,289.43 |
| Nov 2, 08:45 | $78,334.22 |
| Nov 2, 09:45 | $78,496.11 |
| Nov 2, 10:45 | $78,287.80 |
| Nov 2, 11:45 | $78,248.98 |
| Nov 2, 12:45 | $78,037.69 |
| Nov 2, 13:45 | $77,988.09 |
| Nov 2, 14:45 | $78,124.46 |
| Nov 2, 15:45 | $77,954.17 |
| Nov 2, 16:45 | $77,857.77 |
| Nov 2, 17:45 | $77,783.67 |
| Nov 2, 18:45 | $77,674.24 |
| Nov 2, 19:45 | $77,797.47 |
| Nov 2, 20:45 | $77,733.93 |
| Nov 2, 21:45 | $77,399.97 |
| Nov 2, 22:45 | $77,370.37 |
| Nov 2, 23:45 | $77,028.36 |
| Nov 3, 00:45 | $76,882.82 |
| Nov 3, 01:45 | $76,957.58 |
| Nov 3, 02:45 | $76,641.36 |
| Nov 3, 03:45 | $76,702.75 |
| Nov 3, 04:45 | $76,788.50 |
| Nov 3, 05:45 | $76,674.13 |
| Nov 3, 06:45 | $76,997.24 |
| Nov 3, 07:45 | $76,983.92 |
| Nov 3, 08:45 | $76,582.48 |
| Nov 3, 09:45 | $76,799.52 |
| Nov 3, 10:45 | $76,806.47 |
| Nov 3, 11:45 | $76,515.93 |
| Nov 3, 12:45 | $76,455.25 |
| Nov 3, 13:45 | $76,677.32 |
| Nov 3, 14:45 | $76,497.70 |
| Nov 3, 15:45 | $76,946.61 |
| Nov 3, 16:45 | $77,003.94 |
| Nov 3, 17:45 | $76,969.48 |
| Nov 3, 18:45 | $77,299.05 |
| Nov 3, 19:45 | $77,252.29 |
| Nov 3, 20:45 | $77,247.35 |
| Nov 3, 21:45 | $77,577.38 |
| Nov 3, 22:45 | $77,623.15 |
| Nov 3, 23:45 | $77,550.54 |
| Nov 4, 00:45 | $77,498.05 |
| Nov 4, 01:45 | $77,518.88 |
| Nov 4, 02:45 | $77,784.25 |
| Nov 4, 03:45 | $77,803.01 |
| Nov 4, 04:45 | $77,779.33 |
| Nov 4, 05:45 | $77,336.75 |
| Nov 4, 06:45 | $77,122.62 |
| Nov 4, 07:45 | $76,919.24 |
| Nov 4, 08:45 | $76,040.02 |
| Nov 4, 09:45 | $76,368.51 |
| Nov 4, 10:45 | $77,263.83 |
| Nov 4, 11:45 | $77,630.62 |
| Nov 4, 12:45 | $77,882.29 |
| Nov 4, 13:45 | $78,018.51 |
| Nov 4, 14:45 | $78,389.17 |
| Nov 4, 15:45 | $78,282.82 |
| Nov 4, 16:45 | $78,490.26 |
| Nov 4, 17:45 | $78,373.62 |
| Nov 4, 18:45 | $78,189.70 |
| Nov 4, 19:45 | $78,256.57 |
| Nov 4, 20:45 | $79,236.59 |
| Nov 4, 21:45 | $80,214.23 |
| Nov 4, 22:45 | $80,462.60 |
| Nov 4, 23:45 | $80,350.00 |
| Nov 5, 00:45 | $80,276.37 |
| Nov 5, 01:45 | $79,915.50 |
| Nov 5, 02:45 | $80,044.01 |
| Nov 5, 03:45 | $80,155.44 |
| Nov 5, 04:45 | $80,638.95 |
| Nov 5, 05:45 | $80,428.31 |
| Nov 5, 06:45 | $80,467.13 |
View chart data
| Time | Value |
|---|---|
| Nov 4, 07:45 | $2,254.19 |
| Nov 4, 08:45 | $2,246.28 |
| Nov 4, 09:45 | $2,262.78 |
| Nov 4, 10:45 | $2,285.06 |
| Nov 4, 11:45 | $2,296.38 |
| Nov 4, 12:45 | $2,301.77 |
| Nov 4, 13:45 | $2,322.59 |
| Nov 4, 14:45 | $2,317.17 |
| Nov 4, 15:45 | $2,330.64 |
| Nov 4, 16:45 | $2,334.02 |
| Nov 4, 17:45 | $2,317.53 |
| Nov 4, 18:45 | $2,317.39 |
| Nov 4, 19:45 | $2,332.56 |
| Nov 4, 20:45 | $2,436.97 |
| Nov 4, 21:45 | $2,437.50 |
| Nov 4, 22:45 | $2,423.95 |
| Nov 4, 23:45 | $2,426.52 |
| Nov 5, 00:45 | $2,417.14 |
| Nov 5, 01:45 | $2,419.21 |
| Nov 5, 02:45 | $2,417.59 |
| Nov 5, 03:45 | $2,442.73 |
| Nov 5, 04:45 | $2,427.33 |
| Nov 5, 05:45 | $2,425.92 |
| Nov 5, 06:45 | $2,419.75 |
| Nov 5, 06:57 | $2,419.75 |
View chart data
| Time | Value |
|---|---|
| Oct 29, 07:45 | $2,310.99 |
| Oct 29, 08:45 | $2,308.95 |
| Oct 29, 09:45 | $2,305.78 |
| Oct 29, 10:45 | $2,318.40 |
| Oct 29, 11:45 | $2,319.70 |
| Oct 29, 12:45 | $2,310.29 |
| Oct 29, 13:45 | $2,306.93 |
| Oct 29, 14:45 | $2,315.80 |
| Oct 29, 15:45 | $2,318.54 |
| Oct 29, 16:45 | $2,325.90 |
| Oct 29, 17:45 | $2,322.01 |
| Oct 29, 18:45 | $2,319.85 |
| Oct 29, 19:45 | $2,324.26 |
| Oct 29, 20:45 | $2,341.78 |
| Oct 29, 21:45 | $2,367.14 |
| Oct 29, 22:45 | $2,350.55 |
| Oct 29, 23:45 | $2,338.55 |
| Oct 30, 00:45 | $2,328.54 |
| Oct 30, 01:45 | $2,333.81 |
| Oct 30, 02:45 | $2,255.42 |
| Oct 30, 03:45 | $2,270.48 |
| Oct 30, 04:45 | $2,271.82 |
| Oct 30, 05:45 | $2,248.34 |
| Oct 30, 06:45 | $2,218.71 |
| Oct 30, 07:45 | $2,191.38 |
| Oct 30, 08:45 | $2,205.74 |
| Oct 30, 09:45 | $2,232.46 |
| Oct 30, 10:45 | $2,238.34 |
| Oct 30, 11:45 | $2,234.60 |
| Oct 30, 12:45 | $2,249.85 |
| Oct 30, 13:45 | $2,233.32 |
| Oct 30, 14:45 | $2,225.26 |
| Oct 30, 15:45 | $2,226.25 |
| Oct 30, 16:45 | $2,245.98 |
| Oct 30, 17:45 | $2,233.40 |
| Oct 30, 18:45 | $2,231.10 |
| Oct 30, 19:45 | $2,222.06 |
| Oct 30, 20:45 | $2,233.38 |
| Oct 30, 21:45 | $2,223.72 |
| Oct 30, 22:45 | $2,229.61 |
| Oct 30, 23:45 | $2,240.36 |
| Oct 31, 00:45 | $2,228.48 |
| Oct 31, 01:45 | $2,235.03 |
| Oct 31, 02:45 | $2,235.40 |
| Oct 31, 03:45 | $2,234.30 |
| Oct 31, 04:45 | $2,231.94 |
| Oct 31, 05:45 | $2,241.07 |
| Oct 31, 06:45 | $2,245.39 |
| Oct 31, 07:45 | $2,240.54 |
| Oct 31, 08:45 | $2,242.55 |
| Oct 31, 09:45 | $2,236.48 |
| Oct 31, 10:45 | $2,236.09 |
| Oct 31, 11:45 | $2,239.05 |
| Oct 31, 12:45 | $2,242.42 |
| Oct 31, 13:45 | $2,240.67 |
| Oct 31, 14:45 | $2,238.57 |
| Oct 31, 15:45 | $2,242.33 |
| Oct 31, 16:45 | $2,241.68 |
| Oct 31, 17:45 | $2,245.06 |
| Oct 31, 18:45 | $2,249.60 |
| Oct 31, 19:45 | $2,248.38 |
| Oct 31, 20:45 | $2,243.01 |
| Oct 31, 21:45 | $2,247.54 |
| Oct 31, 22:45 | $2,248.10 |
| Oct 31, 23:45 | $2,252.15 |
| Nov 1, 00:45 | $2,252.28 |
| Nov 1, 01:45 | $2,250.99 |
| Nov 1, 02:45 | $2,250.48 |
| Nov 1, 03:45 | $2,252.61 |
| Nov 1, 04:45 | $2,251.20 |
| Nov 1, 05:45 | $2,252.66 |
| Nov 1, 06:45 | $2,259.15 |
| Nov 1, 07:45 | $2,266.86 |
| Nov 1, 08:45 | $2,261.82 |
| Nov 1, 09:45 | $2,264.76 |
| Nov 1, 10:45 | $2,263.37 |
| Nov 1, 11:45 | $2,266.86 |
| Nov 1, 12:45 | $2,266.42 |
| Nov 1, 13:45 | $2,267.17 |
| Nov 1, 14:45 | $2,273.25 |
| Nov 1, 15:45 | $2,267.42 |
| Nov 1, 16:45 | $2,266.93 |
| Nov 1, 17:45 | $2,267.01 |
| Nov 1, 18:45 | $2,258.71 |
| Nov 1, 19:45 | $2,264.75 |
| Nov 1, 20:45 | $2,268.62 |
| Nov 1, 21:45 | $2,263.81 |
| Nov 1, 22:45 | $2,266.79 |
| Nov 1, 23:45 | $2,261.78 |
| Nov 2, 00:45 | $2,260.55 |
| Nov 2, 01:45 | $2,256.43 |
| Nov 2, 02:45 | $2,261.03 |
| Nov 2, 03:45 | $2,261.39 |
| Nov 2, 04:45 | $2,257.06 |
| Nov 2, 05:45 | $2,272.23 |
| Nov 2, 06:45 | $2,270.40 |
| Nov 2, 07:45 | $2,286.92 |
| Nov 2, 08:45 | $2,292.37 |
| Nov 2, 09:45 | $2,306.05 |
| Nov 2, 10:45 | $2,290.10 |
| Nov 2, 11:45 | $2,289.15 |
| Nov 2, 12:45 | $2,282.60 |
| Nov 2, 13:45 | $2,281.70 |
| Nov 2, 14:45 | $2,294.67 |
| Nov 2, 15:45 | $2,287.87 |
| Nov 2, 16:45 | $2,283.54 |
| Nov 2, 17:45 | $2,283.43 |
| Nov 2, 18:45 | $2,282.40 |
| Nov 2, 19:45 | $2,283.59 |
| Nov 2, 20:45 | $2,288.08 |
| Nov 2, 21:45 | $2,270.09 |
| Nov 2, 22:45 | $2,266.01 |
| Nov 2, 23:45 | $2,256.05 |
| Nov 3, 00:45 | $2,250.23 |
| Nov 3, 01:45 | $2,250.01 |
| Nov 3, 02:45 | $2,244.28 |
| Nov 3, 03:45 | $2,254.38 |
| Nov 3, 04:45 | $2,252.99 |
| Nov 3, 05:45 | $2,249.66 |
| Nov 3, 06:45 | $2,254.66 |
| Nov 3, 07:45 | $2,254.14 |
| Nov 3, 08:45 | $2,248.24 |
| Nov 3, 09:45 | $2,249.62 |
| Nov 3, 10:45 | $2,253.42 |
| Nov 3, 11:45 | $2,244.47 |
| Nov 3, 12:45 | $2,242.27 |
| Nov 3, 13:45 | $2,253.98 |
| Nov 3, 14:45 | $2,253.37 |
| Nov 3, 15:45 | $2,264.56 |
| Nov 3, 16:45 | $2,268.50 |
| Nov 3, 17:45 | $2,263.29 |
| Nov 3, 18:45 | $2,279.31 |
| Nov 3, 19:45 | $2,282.63 |
| Nov 3, 20:45 | $2,283.45 |
| Nov 3, 21:45 | $2,295.99 |
| Nov 3, 22:45 | $2,294.92 |
| Nov 3, 23:45 | $2,293.59 |
| Nov 4, 00:45 | $2,290.23 |
| Nov 4, 01:45 | $2,284.28 |
| Nov 4, 02:45 | $2,288.07 |
| Nov 4, 03:45 | $2,291.72 |
| Nov 4, 04:45 | $2,290.41 |
| Nov 4, 05:45 | $2,271.64 |
| Nov 4, 06:45 | $2,271.28 |
| Nov 4, 07:45 | $2,260.77 |
| Nov 4, 08:45 | $2,240.77 |
| Nov 4, 09:45 | $2,245.74 |
| Nov 4, 10:45 | $2,276.68 |
| Nov 4, 11:45 | $2,289.77 |
| Nov 4, 12:45 | $2,294.30 |
| Nov 4, 13:45 | $2,300.00 |
| Nov 4, 14:45 | $2,319.78 |
| Nov 4, 15:45 | $2,319.06 |
| Nov 4, 16:45 | $2,325.09 |
| Nov 4, 17:45 | $2,324.88 |
| Nov 4, 18:45 | $2,311.16 |
| Nov 4, 19:45 | $2,316.11 |
| Nov 4, 20:45 | $2,376.02 |
| Nov 4, 21:45 | $2,423.88 |
| Nov 4, 22:45 | $2,432.87 |
| Nov 4, 23:45 | $2,422.59 |
| Nov 5, 00:45 | $2,420.94 |
| Nov 5, 01:45 | $2,403.88 |
| Nov 5, 02:45 | $2,418.76 |
| Nov 5, 03:45 | $2,415.94 |
| Nov 5, 04:45 | $2,433.91 |
| Nov 5, 05:45 | $2,422.27 |
| Nov 5, 06:45 | $2,419.23 |
Charts show the stored snapshot this edition was built from (Nov 5, 2026, 06:57 (Asia/Kathmandu, UTC+05:45)); prices in US dollars, changes in percent. Hover or tap a mark for its value; each chart has a data table.
Market heatmap and top gainers and losers
View chart data
| Asset | Market cap | 24h change |
|---|---|---|
| Bitcoin (BTC) | $1.61T | +4.74% |
| Ethereum (ETH) | $296.12B | +6.96% |
| Tether (USDT) | $183.11B | +0.12% |
| Binance Coin (BNB) | $99.97B | +3.57% |
| XRP (XRP) | $77.87B | +3.92% |
| USD Coin (USDC) | $74.03B | −0.04% |
| Solana (SOL) | $52.01B | +4.32% |
| TRON (TRX) | $30.25B | −0.92% |
| Hyperliquid (HYPE) | $28.15B | +0.97% |
| Zcash (ZEC) | $20.95B | +7.27% |
View chart data
| Asset | 24h change |
|---|---|
| Raydium (RAY) | +15.31% |
| Injective Protocol (INJ) | +11.54% |
| Stacks (STX) | +10.94% |
| Algorand (ALGO) | +9.16% |
| Render (RENDER) | +9.10% |
| Stable (STABLE) | −4.05% |
| Venice Token (VVV) | −4.04% |
| JUST (JST) | −1.73% |
| LayerZero (ZRO) | −1.46% |
| TRON (TRX) | −0.92% |
Ranked by 24-hour change among the top 100 assets by market capitalization, stablecoins excluded (87 assets with a reported 24-hour change).
| Asset | Price (USD) | 24h change | Market cap | 24h volume |
|---|---|---|---|---|
| Raydium RAY | $1.75 | +15.31% | $469.26M | $33.25M |
| Injective Protocol INJ | $7.96 | +11.54% | $777.45M | $79.40M |
| Stacks STX | $0.3584 | +10.94% | $645.14M | $33.25M |
| Algorand ALGO | $0.09984 | +9.16% | $876.75M | $22.20M |
| Render RENDER | $1.60 | +9.10% | $828.04M | $19.44M |
| Asset | Price (USD) | 24h change | Market cap | 24h volume |
|---|---|---|---|---|
| Stable STABLE | $0.02658 | −4.05% | $587.24M | $9.16M |
| Venice Token VVV | $21.28 | −4.04% | $779.68M | $36.37M |
| JUST JST | $0.1401 | −1.73% | $1.39B | $30.58M |
| LayerZero ZRO | $1.81 | −1.46% | $449.20M | $71.52M |
| TRON TRX | $0.3196 | −0.92% | $30.25B | $415.65M |
Total market capitalization and trading volume
| Metric | Value | 24h change | Vs previous report |
|---|---|---|---|
| Total crypto market capitalization | $2.70 trillion | +4.71% | +4.71% |
| Total 24h trading volume | $322.54 billion | n/a | +25.55% |
| Bitcoin market capitalization | $1.61 trillion | +4.74% | +4.69% |
| Ether market capitalization | $296.12 billion | +6.96% | +6.90% |
Bitcoin dominance and market sentiment
Measured: Bitcoin accounted for 59.66% of total crypto market capitalization and Ether for 10.98% (Bitcoin dominance +0.04 pts versus the previous report). The Crypto Fear & Greed Index read 50 out of 100 (“Neutral”), compared with 34 (“Fear”) at the previous report. The index is published once per day by Alternative.me.
View chart data
| Time | Value |
|---|---|
| Oct 21 | $2.80T |
| Oct 22 | $2.68T |
| Oct 23 | $2.70T |
| Oct 24 | $2.65T |
| Oct 25 | $2.65T |
| Oct 26 | $2.64T |
| Oct 27 | $2.66T |
| Oct 28 | $2.70T |
| Oct 29 | $2.64T |
| Oct 30 | $2.61T |
| Oct 31 | $2.58T |
| Nov 1 | $2.58T |
| Nov 2 | $2.56T |
| Nov 3 | $2.60T |
| Nov 4 | $2.69T |
| Nov 5 | $2.70T |
View chart data
| Time | Value |
|---|---|
| Oct 21 | 60.18% |
| Oct 22 | 60.54% |
| Oct 23 | 60.12% |
| Oct 24 | 60.76% |
| Oct 25 | 60.70% |
| Oct 26 | 60.53% |
| Oct 27 | 60.64% |
| Oct 28 | 60.25% |
| Oct 29 | 59.15% |
| Oct 30 | 58.96% |
| Oct 31 | 60.07% |
| Nov 1 | 60.51% |
| Nov 2 | 59.96% |
| Nov 3 | 59.65% |
| Nov 4 | 59.77% |
| Nov 5 | 59.66% |
View chart data
| Date (UTC) | Index (0–100) |
|---|---|
| 2026-10-23 | 50 (Neutral) |
| 2026-10-24 | 51 (Neutral) |
| 2026-10-25 | 54 (Neutral) |
| 2026-10-26 | 50 (Neutral) |
| 2026-10-27 | 48 (Neutral) |
| 2026-10-28 | 51 (Neutral) |
| 2026-10-29 | 51 (Neutral) |
| 2026-10-30 | 30 (Fear) |
| 2026-10-31 | 30 (Fear) |
| 2026-11-01 | 34 (Fear) |
| 2026-11-02 | 37 (Fear) |
| 2026-11-03 | 26 (Fear) |
| 2026-11-04 | 34 (Fear) |
| 2026-11-05 | 50 (Neutral) |
Important crypto news and developments
Headlines published by the monitored crypto outlets during the reporting window, verified for source, link and publication time. Summaries are not reproduced — follow the links for the original reporting.
- Mercado Bitcoin says phased reopening to begin Monday, will cover losses — Cointelegraph, Nov 5, 2026, 05:05
- Tokenization and stablecoins may weather Democrats' sweep as broader crypto rules face uncertainty — CoinDesk, Nov 5, 2026, 04:40
- Crypto's Washington hopes fade, but Grayscale and BlackRock see growth ahead — CoinDesk, Nov 5, 2026, 04:36
- Why Bitcoin's Next Soft Fork Could Feel Like a Practice Run — Decrypt, Nov 5, 2026, 04:31
- Democratic sweep of Congress forces crypto industry to rethink Washington strategy — The Block, Nov 5, 2026, 03:39
- Bitcoin rebounds past $80,000 as markets shrug off midterms and Binance hack — The Block, Nov 5, 2026, 01:54
What moved the market: major price movements and possible contributing factors
Measured: significant changes under this report's fixed thresholds:
- 91.95% of tracked assets rose — an unusually one-sided session.
- The Fear & Greed Index changed +16.00 pts versus the previous daily report.
- ETH moved +6.96% in 24 hours (threshold 4%).
- BTC moved +4.74% in 24 hours (threshold 3%).
- Total market capitalization changed +4.71% versus the previous daily report.
- Ether's 24-hour change differed from Bitcoin's by +2.22 pts.
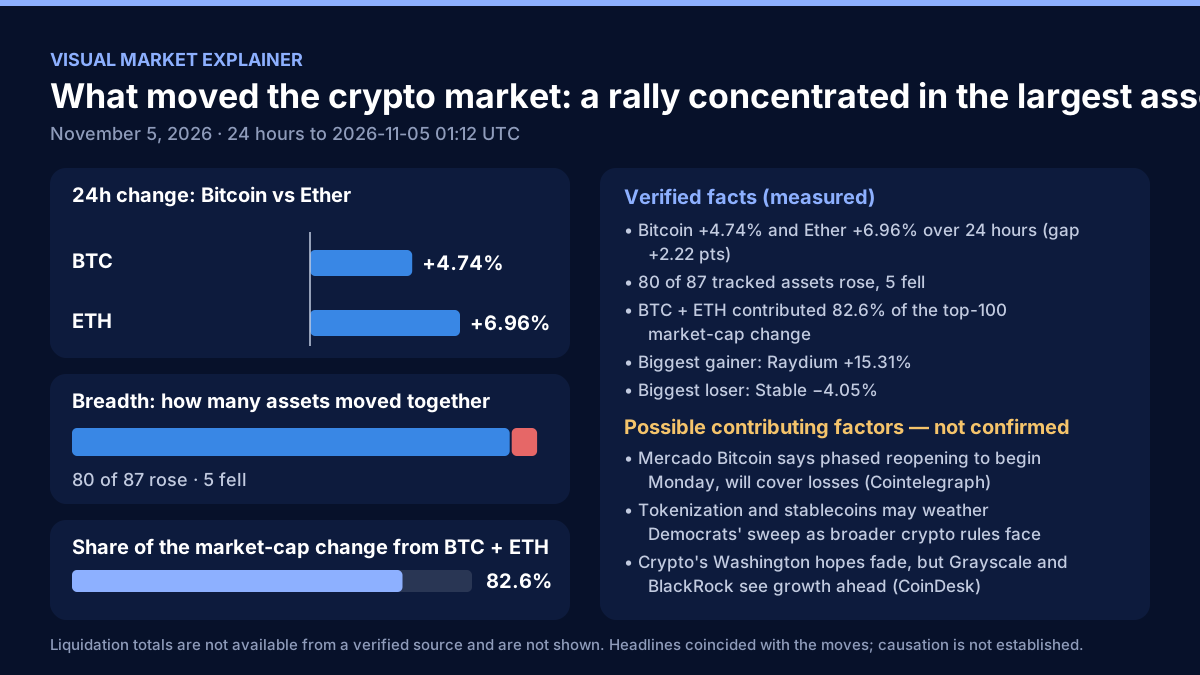
Measured: the session was a rally concentrated in the largest assets.
- Bitcoin +4.74% and Ether +6.96% over 24 hours (gap +2.22 pts)
- 80 of 87 tracked assets rose, 5 fell
- BTC + ETH contributed 82.6% of the top-100 market-cap change
- Biggest gainer: Raydium +15.31%
- Biggest loser: Stable −4.05%
Possible contributing factors (not confirmed): these verified headlines were published in the same window; the data does not establish that any of them caused the moves.
- Mercado Bitcoin says phased reopening to begin Monday, will cover losses — Cointelegraph
- Tokenization and stablecoins may weather Democrats' sweep as broader crypto rules face uncertainty — CoinDesk
- Crypto's Washington hopes fade, but Grayscale and BlackRock see growth ahead — CoinDesk
Liquidation totals are not available from a verified source and are not shown.
Analysis: The increase in Bitcoin's price may have been driven by the market's reaction to the US midterms, as reported by The Block, and the rebound in Bitcoin's price past $80,000, as noted by The Block, may have also been influenced by the market's ability to shrug off the Binance hack. The rise in Ether's price may have been influenced by the broader crypto market trend, as well as the potential for growth ahead, as seen by Grayscale and BlackRock, according to CoinDesk. The phased reopening of Mercado Bitcoin, as reported by Cointelegraph, may have also contributed to the positive market sentiment. The potential for tokenization and stablecoins to weather the Democrats' sweep, as reported by CoinDesk, may have also played a role in the increase in crypto prices. The increase in Bitcoin's dominance, albeit small at 0.04 pts, may suggest a slight shift in market preference towards Bitcoin,…
Technical reference levels
| Pair | 7-day low (support) | 7-day high (resistance) | 20-day average close | Last daily close |
|---|---|---|---|---|
| BTC-USD | $75,600.64 | $81,890.00 | $80,200.29 | $80,428.31 |
| ETH-USD | $2,170.03 | $2,448.26 | $2,349.25 | $2,422.27 |
Method: Support and resistance are the lowest low and highest high of the last 7 completed daily candles on the Coinbase Exchange USD-quoted spot pair; the trend reference is the simple average of the last 20 daily closes. These are descriptive reference levels, not forecasts.
Bullish, neutral and bearish scenarios
Scenarios are conditional interpretation, not forecasts.
Bullish scenario
Analysis: If the market continues to shrug off negative news and the Crypto Fear & Greed Index remains in Neutral territory, then the crypto market may continue to rise, with Bitcoin's price potentially reaching new highs. If the growth prospects seen by Grayscale and BlackRock materialize, then the crypto market may experience a sustained bullish trend. If the phased reopening of Mercado Bitcoin is successful, then it may contribute to a further increase in crypto prices, as it may help to restore confidence in the market. If the potential for tokenization and stablecoins to weather the Democrats' sweep is realized, then it may also contribute to a further increase in crypto prices.
Neutral scenario
Analysis: If the Crypto Fear & Greed Index remains in Neutral territory and the market continues to trade within established ranges, then the crypto market may experience a period of consolidation, with prices potentially fluctuating around current levels. If the market's reaction to the US midterms and the rebound in Bitcoin's price past $80,000 is short-lived, then the crypto market may return to a neutral stance. If the growth prospects seen by Grayscale and BlackRock do not materialize, then the crypto market may experience a period of stagnation, with prices potentially remaining flat. If the phased reopening of Mercado Bitcoin is not successful, then it may contribute to a decrease in crypto prices, as it may help to undermine confidence in the market.
Bearish scenario
Analysis: A weaker scenario would involve Bitcoin losing the 7-day low of $75,600.64, which would put the current neutral sentiment under pressure and typically weighs hardest on smaller assets.
Key risks and upcoming events
Analysis: The key risks visible in the data and headlines include the potential for unfavorable regulatory developments for the crypto industry, as reported by The Block, and the risk of a decline in market sentiment, as evidenced by the Crypto Fear & Greed Index. The market's reaction to the US midterms and the rebound in Bitcoin's price past $80,000 may be short-lived, and the crypto market may experience a sharp decline if the growth prospects seen by Grayscale and BlackRock do not materialize. The phased reopening of Mercado Bitcoin may not be successful, which may contribute to a decrease in crypto prices, as it may help to undermine confidence in the market. The potential for tokenization and stablecoins to weather the Democrats' sweep may not be realized, which may also contribute to a decrease in crypto prices.
Market outlook for the next 24 hours
Analysis: In the next 24 hours, it will be important to watch the Crypto Fear & Greed Index and the market's reaction to any potential regulatory developments, as well as the performance of Bitcoin and Ether. The success of the phased reopening of Mercado Bitcoin will also be closely watched, as it may have a significant impact on market sentiment. The market's ability to continue shrugging off negative news and the growth prospects seen by Grayscale and BlackRock will also be important to monitor, as they may have a significant impact on the future direction of the crypto market. The potential for tokenization and stablecoins to weather the Democrats' sweep will also be closely watched, as it may have a significant impact on the future direction of the crypto market.
Tomorrow's crypto trading plan
Session covered: Nov 5, 06:57 → Nov 6, 06:55 Nepal time (2026-11-05 01:12 UTC → 2026-11-06 01:10 UTC). Candle data as of: 2026-11-05 01:00 UTC. Crypto trades around the clock, so “tomorrow” means the period until the next daily edition. This is decision support built from closed candles fetched for this edition — not a signal service, and it never places orders.
Market bias: neutral (Bitcoin neutral, Ether neutral, 92% of tracked assets up). Overall: Wait for confirmation — no trade is preferable today.
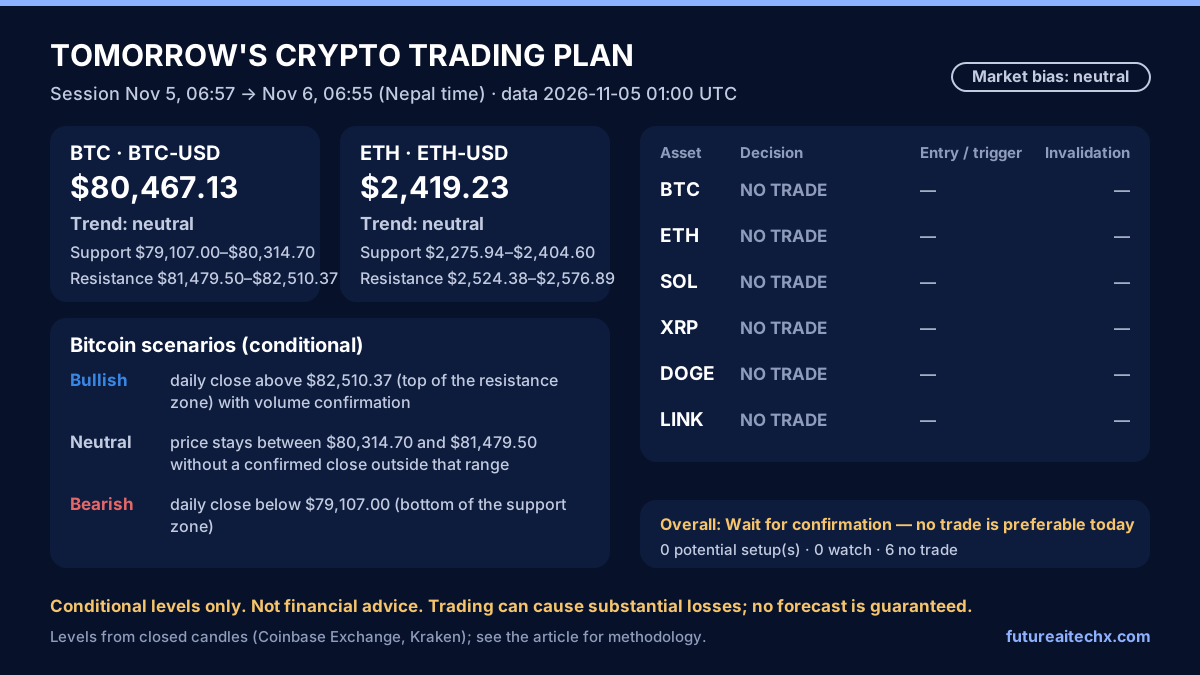
Buy / sell / watch table
| Asset | Price | Direction | Decision | Entry / confirmation | Support | Resistance | Invalidation | Targets | R:R | Holding | Confidence |
|---|---|---|---|---|---|---|---|---|---|---|---|
| BTC BTC-USD | $80,467.13 | neutral | NO TRADE | No entry | $79,107.00–$80,314.70 | $81,479.50–$82,510.37 | — | — | — | — | n/a |
| ETH ETH-USD | $2,419.23 | neutral | NO TRADE | No entry | $2,275.94–$2,404.60 | $2,524.38–$2,576.89 | — | — | — | — | n/a |
| SOL SOL-USD | $95.66 | neutral | NO TRADE | No entry | $73.31–$78.96 | $95.71–$100.32 | — | — | — | — | n/a |
| XRP XRP-USD | $1.30 | neutral | NO TRADE | No entry | $1.25–$1.25 | $1.31–$1.36 | — | — | — | — | n/a |
| DOGE DOGE-USD | $0.07690 | neutral | NO TRADE | No entry | $0.07084–$0.07601 | $0.07826–$0.08138 | — | — | — | — | n/a |
| LINK LINK/USD | $11.38 | neutral | NO TRADE | No entry | $10.61–$11.01 | $11.52 | — | — | — | — | n/a |
No trade setup qualifies today. None of the analysed assets meets every condition (trend alignment, a defined trigger and invalidation, and at least 1.5 : 1 reward-to-risk). Waiting for confirmation is preferable to taking a weak trade.
Asset-by-asset analysis and scenarios
BTC — NO TRADE
Why: Timeframes disagree (alignment +2/4) — no edge; waiting is preferable to a weak trade.
Main risk: A sudden directional break with news; no position means no exposure to it.
Evidence (Coinbase Exchange BTC-USD, last closed 1h candle, data 2026-11-05 01:00 UTC): trend 1h up · 4h flat · 1d flat · 1w up; daily RSI(14) 50.7; daily MACD histogram -159.0550; ATR(14) $2,234.28 (2.78% of price); volume 2.36× the 20-day average; 7-day range $75,600.64–$81,890.00.
- Bullish: if there is a daily close above $82,510.37 (top of the resistance zone) with volume confirmation, an upward setup would be confirmed; invalidation $79,158.96; next resistance $84,261.99.
- Bearish: a daily close below $79,107.00 (bottom of the support zone) would support a bearish case; invalidation $82,458.41; next support $76,845.71.
- Neutral: if price stays between $80,314.70 and $81,479.50 without a confirmed close outside that range, waiting is preferable.
Spot: no new positions; the data does not support an action today. Derivatives: no long or short setup.
News risk: The Block: Bitcoin rebounds past $80,000 as markets shrug off midterms and Binance hack
Derivatives context (OKX perpetual swaps, BTC-USDT-SWAP): funding rate 0.0076% per interval; open interest $2.69B. Liquidation totals: not available from a verified source.
ETH — NO TRADE
Why: Timeframes disagree (alignment +2/4) — no edge; waiting is preferable to a weak trade.
Main risk: A sudden directional break with news; no position means no exposure to it.
Evidence (Coinbase Exchange ETH-USD, last closed 1h candle, data 2026-11-05 01:00 UTC): trend 1h up · 4h up · 1d flat · 1w flat; daily RSI(14) 54.1; daily MACD histogram 8.1159; ATR(14) $92.15 (3.81% of price); volume 2.13× the 20-day average; 7-day range $2,170.03–$2,448.26.
- Bullish: if there is a daily close above $2,576.89 (top of the resistance zone) with volume confirmation, an upward setup would be confirmed; invalidation $2,438.66; next resistance $2,626.94.
- Bearish: a daily close below $2,275.94 (bottom of the support zone) would support a bearish case; invalidation $2,414.17; next support $2,170.03.
- Neutral: if price stays between $2,404.60 and $2,524.38 without a confirmed close outside that range, waiting is preferable.
Spot: no new positions; the data does not support an action today. Derivatives: no long or short setup.
Derivatives context (OKX perpetual swaps, ETH-USDT-SWAP): funding rate 0.0068% per interval; open interest $1.55B. Liquidation totals: not available from a verified source.
SOL — NO TRADE
Why: Timeframes disagree (alignment +0/4) — no edge; waiting is preferable to a weak trade.
Main risk: A sudden directional break with news; no position means no exposure to it.
Evidence (Coinbase Exchange SOL-USD, last closed 1h candle, data 2026-11-05 01:00 UTC): trend 1h up · 4h flat · 1d down · 1w flat; daily RSI(14) 37.1; daily MACD histogram -0.5343; ATR(14) $4.54 (4.75% of price); volume 2.31× the 20-day average; 7-day range $89.73–$103.08.
- Bullish: if there is a daily close above $100.32 (top of the resistance zone) with volume confirmation, an upward setup would be confirmed; invalidation $93.51; next resistance $103.77.
- Bearish: a daily close below $73.31 (bottom of the support zone) would support a bearish case; invalidation $80.12; next support $70.51.
- Neutral: if price stays between $78.96 and $95.71 without a confirmed close outside that range, waiting is preferable.
Spot: no new positions; the data does not support an action today. Derivatives: no long or short setup.
XRP — NO TRADE
Why: Timeframes disagree (alignment +1/4) — no edge; waiting is preferable to a weak trade.
Main risk: A sudden directional break with news; no position means no exposure to it.
Evidence (Coinbase Exchange XRP-USD, last closed 1h candle, data 2026-11-05 01:00 UTC): trend 1h up · 4h flat · 1d flat · 1w flat; daily RSI(14) 48.0; daily MACD histogram 0.0031; ATR(14) $0.05558 (4.27% of price); volume 1.40× the 20-day average; 7-day range $1.20–$1.34.
- Bullish: if there is a daily close above $1.36 (top of the resistance zone) with volume confirmation, an upward setup would be confirmed; invalidation $1.27; next resistance $1.40.
- Bearish: a daily close below $1.25 (bottom of the support zone) would support a bearish case; invalidation $1.33; next support $1.20.
- Neutral: if price stays between $1.25 and $1.31 without a confirmed close outside that range, waiting is preferable.
Spot: no new positions; the data does not support an action today. Derivatives: no long or short setup.
DOGE — NO TRADE
Why: Timeframes disagree (alignment -1/4) — no edge; waiting is preferable to a weak trade.
Main risk: A sudden directional break with news; no position means no exposure to it.
Evidence (Coinbase Exchange DOGE-USD, last closed 1h candle, data 2026-11-05 01:00 UTC): trend 1h up · 4h flat · 1d down · 1w down; daily RSI(14) 42.7; daily MACD histogram 0.0001; ATR(14) $0.003673 (4.78% of price); volume 1.58× the 20-day average; 7-day range $0.07209–$0.08138.
- Bullish: if there is a daily close above $0.08138 (top of the resistance zone) with volume confirmation, an upward setup would be confirmed; invalidation $0.07587; next resistance $0.08374.
- Bearish: a daily close below $0.07084 (bottom of the support zone) would support a bearish case; invalidation $0.07635; next support $0.06893.
- Neutral: if price stays between $0.07601 and $0.07826 without a confirmed close outside that range, waiting is preferable.
Spot: no new positions; the data does not support an action today. Derivatives: no long or short setup.
LINK — NO TRADE
Why: Timeframes disagree (alignment +1/4) — no edge; waiting is preferable to a weak trade.
Main risk: A sudden directional break with news; no position means no exposure to it.
Evidence (Kraken LINK/USD, mid of best bid/ask, data 2026-11-05 01:00 UTC): trend 1h up · 4h flat · 1d down · 1w up; daily RSI(14) 45.0; daily MACD histogram -0.0047; ATR(14) $0.7027 (6.17% of price); volume 2.48× the 20-day average; 7-day range $10.25–$12.00; spread 0.022%.
- Bullish: if there is a daily close above $11.52 (top of the resistance zone) with volume confirmation, an upward setup would be confirmed; invalidation $10.47; next resistance $12.00.
- Bearish: a daily close below $10.61 (bottom of the support zone) would support a bearish case; invalidation $11.66; next support $10.25.
- Neutral: if price stays between $11.01 and $11.52 without a confirmed close outside that range, waiting is preferable.
Spot: no new positions; the data does not support an action today. Derivatives: no long or short setup.
Method, confidence and backtest
- SMA(n): arithmetic mean of the last n closing prices.
- EMA(n): exponential moving average with α = 2/(n+1), seeded with the SMA of the first n closes.
- RSI(14): Wilder-smoothed average gain ÷ average loss over 14 closed candles; RSI = 100 − 100/(1 + RS).
- MACD(12,26,9): EMA(12) − EMA(26) of closes; signal line = EMA(9) of MACD; histogram = MACD − signal.
- ATR(14): Wilder-smoothed true range, where true range = max(high − low, |high − previous close|, |low − previous close|).
- Volume confirmation: last closed daily volume ÷ 20-day average daily volume (≥ 1.2 counts as confirmation).
- 4-hour candles are built from four consecutive 1-hour candles on UTC 4-hour boundaries; weekly candles from seven daily candles starting Monday 00:00 UTC. Incomplete buckets are discarded.
- Support/resistance zones: daily pivot highs/lows (a candle whose high/low is the extreme of the 3 candles on each side) over the last 120 closed days, clustered when within 0.5 × daily ATR; the nearest zone below/above the current price is used.
- Trend per timeframe: up when close > EMA(20) > EMA(50); down when close < EMA(20) < EMA(50); otherwise flat. When fewer than 50 candles exist, EMA(20) and its 5-candle slope are used.
- Bias: bullish when at least 2 of 4 timeframes (1h, 4h, 1d, 1w) trend up net of those trending down, the daily trend is up and the daily MACD histogram is positive; bearish is the mirror image; anything else is neutral.
- Breakout long: bullish bias and price within 1.5 × daily ATR of the nearest resistance zone. Trigger = a daily close above the zone top with volume ≥ 1.2 × the 20-day average; preferred entry on a retest of the zone. Invalidation = 1.5 × ATR below the trigger, or 0.25 × ATR under a support zone inside that distance.
- Pullback long: bullish bias, price within 1 × ATR of the nearest support zone and daily RSI below 70. Entry zone = support top to support top + 0.5 × ATR; invalidation = 0.75 × ATR below the support zone.
- Breakdown (spot: reduce; derivatives: short): bearish bias and price within 1.5 × ATR of the nearest support zone. Trigger = a daily close below the zone bottom; invalidation = 1.5 × ATR above the trigger, or 0.25 × ATR above a resistance zone inside that distance.
- Targets are the next support/resistance zones. When no zone exists in the 120-day window the target is a 2R / 3R projection and is labelled as such.
- A setup whose reward-to-risk to the first target is below the configured minimum is downgraded to WATCH. Daily RSI above 75 (longs) or below 25 (shorts) also downgrades to WATCH (extended move).
- NO TRADE when: candles are stale (daily older than 36 h, hourly older than 3 h) or incomplete; the venue price differs from the primary data provider by more than the cross-check limit; daily ATR exceeds the configured % of price; or the bid/ask spread exceeds the configured limit.
Confidence score: Data freshness & completeness (up to 20): all four timeframes fresh and computable = 20; one missing = 10; more = 0; Trend alignment (up to 25): share of the 4 timeframes agreeing with the setup direction × 25; Volume confirmation (up to 15): daily volume ≥ 1.2 × 20-day average = 15; ≥ 0.9 × = 7; otherwise 0; Signal agreement (up to 15): daily RSI in the setup's healthy band (50–70 long, 30–50 short) and MACD histogram in the setup direction: 7.5 each; Volatility (up to 10): daily ATR between 1.5% and 6% of price = 10; otherwise 5; above the NO-TRADE limit = 0; Liquidity (up to 10): bid/ask spread ≤ 0.05% = 10; ≤ limit = 5; unknown = 3; News conflict (-10): −10 when a verified headline about the asset reports a hack, exploit, lawsuit, delisting or outage; Historical evidence (up to 5): +5 only when the out-of-sample backtest has ≥ 20 trades and positive expectancy after costs; otherwise 0. Score < 45 = Low · 45–69 = Moderate · ≥ 70 = Relatively Strong. Categories describe the quality of the evidence, not the probability that a trade will be profitable.
Backtest: Walk-forward on daily candles: signal when a daily close breaks a resistance (long) or support (short) zone computed only from prior candles, with the daily trend in the same direction and volume ≥ 1.2 × the 20-day average. Entry at the next daily open ± slippage; stop 1.5 × ATR from the broken level; target = next zone or 2R; exit at stop, target, or the close of day 10. Fees on both sides. When stop and target are both inside one daily range the stop is assumed first. First 70% of the history is in-sample, the last 30% out-of-sample. Pooled across BTC, ETH, SOL, XRP, DOGE, LINK: in-sample 19 trades, 57.9% winners, -0.11R average; out-of-sample 29 trades, 62.1% winners, 0.03R average, after 0.10% fees and 0.05% slippage per side. Out-of-sample expectancy was positive (0.03R over 29 trades) but in-sample was not (-0.11R) — inconsistent results, so no historical edge is claimed.
Position sizing: risk amount = account equity × risk %; long quantity = risk ÷ (entry − stop); short quantity = risk ÷ (stop − entry), using slippage-adjusted fills and fees on both sides. The 1.00% example is an illustrative setting, not a recommendation for every reader.
Data sources and methodology
- CoinLore — asset prices, 24h changes, market caps, volumes — retrieved 2026-11-05 01:12 UTC
- CoinLore — total market cap, 24h volume, dominance — retrieved 2026-11-05 01:12 UTC
- Alternative.me Fear & Greed Index — retrieved 2026-11-05 01:12 UTC
- Coinbase Exchange (spot market data) — BTC/USD and ETH/USD cross-check — retrieved 2026-11-05 01:12 UTC
- News: headlines and links from Cointelegraph, CoinDesk, Decrypt, The Block (RSS feeds / newsroom discovery)
Reporting date: November 5, 2026 (Asia/Kathmandu). Reporting period: 2026-11-04 01:12 UTC – 2026-11-05 01:12 UTC (rolling 24 hours ending at the retrieval time). Data retrieved: Nov 5, 2026, 06:57 (Asia/Kathmandu, UTC+05:45). Currency: US dollars. Data status: snapshot — the figures above are not live and are not updated in this text after publication.
Figures are validated before publication: required fields, timestamps no older than the configured limit, plausible ranges, consistency between the asset and global data, and an independent cross-check of Bitcoin and Ether prices against a major exchange (Coinbase Exchange for this edition). If validation fails, no update is published and the previous edition stays online. Previous edition: Crypto Market Daily Update — November 4, 2026. More coverage: crypto news and live prices, Bitcoin, Ethereum.
Images: no AI illustration was available (no AI image passed the symbol/text check (or generation failed)); the featured image is a data graphic built from the validated figures.
Tomorrow's Crypto Market Outlook: Buy, Sell or Watch?
- Overall market bias: neutral.
- Strongest evidence-supported setups: none — no asset met every condition today.
- Watchlist: no assets on watch.
- What would invalidate the outlook: A daily close below Bitcoin's nearest support zone would invalidate a constructive outlook ($79,107.00).
- Key zones: BTC support $79,107.00–$80,314.70, resistance $81,479.50–$82,510.37; ETH support $2,275.94–$2,404.60, resistance $2,524.38–$2,576.89.
- Scheduled events and news risks: Why Bitcoin's Next Soft Fork Could Feel Like a Practice Run (Decrypt). No verified economic calendar is connected, so scheduled macro events are not listed.
- Risk management: define the trigger, invalidation and position size before entering; risk a small, fixed share of capital per idea (the example uses 1.00%); avoid leverage you cannot sustain through a stop that fills late.
- Trade or wait: Wait for confirmation — no trade is preferable today.
This analysis is informational, not personalized financial advice. Cryptocurrency prices are volatile, trading can result in substantial losses, and no forecast is guaranteed.
Risk disclaimer: cryptocurrency prices are highly volatile and can fall sharply. This report is published for information only. It is not financial, investment, tax or legal advice, not an offer or recommendation to buy or sell any asset, and it makes no price predictions or guarantees. Figures come from the third-party data providers listed above, may differ between providers and may be delayed. Do your own research and consider independent professional advice before making financial decisions.

Join the Discussion
Share your thoughts, questions, or topic suggestions.